
FIGURE 2.
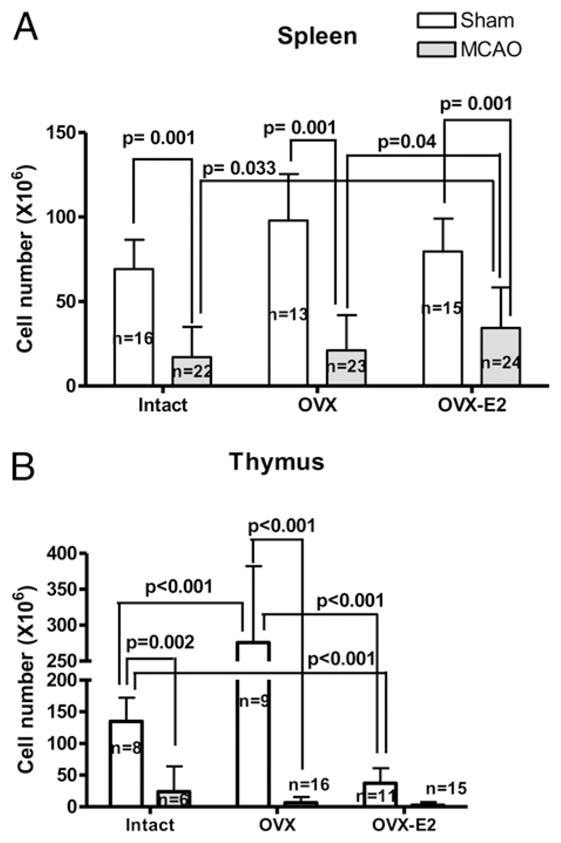
Cell counts of (A) spleen and (B) thymus from animals in Fig. 1 as compared with corresponding sham cohorts. Data are presented as mean ± SD of individual mice.
Official websites use .gov
A
.gov website belongs to an official
government organization in the United States.
Secure .gov websites use HTTPS
A lock (
) or https:// means you've safely
connected to the .gov website. Share sensitive
information only on official, secure websites.
Cell counts of (A) spleen and (B) thymus from animals in Fig. 1 as compared with corresponding sham cohorts. Data are presented as mean ± SD of individual mice.