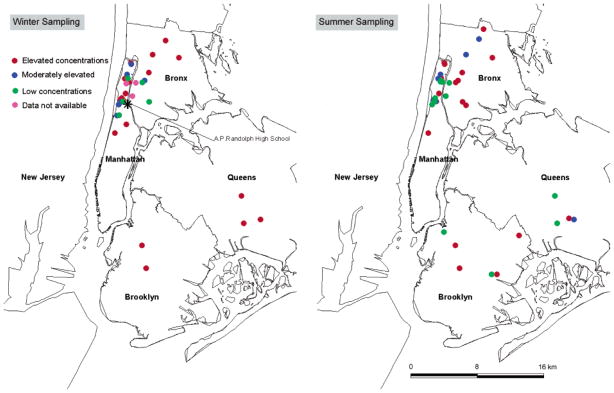
FIGURE 3.
Geographical distribution of elevated exposures displayed by subjects’ home location during New York winter sampling (left) and summer sampling (right). Colors refer to the level of Fe and Mn in personal samples. Red = personal samples with elevated concentrations and Fe/Mn ratios elevated above crustal values. Blue = personal samples with moderately elevated concentrations but Fe/Mn ratios similar to crustal values. Green = personal samples with low concentrations and Fe/Mn ratios similar to crustal values. Purple = personal samples where Fe and Mn data are not available. This simple, descriptive geographical analysis was the first clue that the subway microenvironment should be investigated as a potential source of steel dust exposure since students who lived farthest from school were very likely to ride the subway to school during the winter but not necessarily during the summer.

