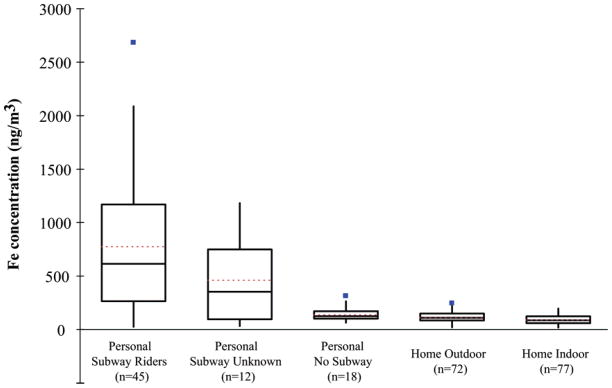
FIGURE 6.
Distribution of airborne Fe in subsets of personal samples, home outdoor samples, and home indoor samples collected in winter and summer field seasons. The personal samples were broken into three subsets: (1) students that had identified that they had ridden the subway; (2) students for which we did not have the information (e.g., lost or incompletely filled out); (3) students who reported that they had not ridden the subway. The number of measurements in each category is given in the x-axis labels. The solid line represents the median, the red dashed line represent the average, and the box top and bottom represent the 75th and 25th percentile concentrations, respectively. The tips and tails of the whiskers represent the most extreme data point within an inner fence (not marked on the diagram) located at 1.5 times the interquartile range (IQR). Filled square symbols show moderate outliers or data points that are located between the inner fence and an outer fence defined as 3 times IQR.

