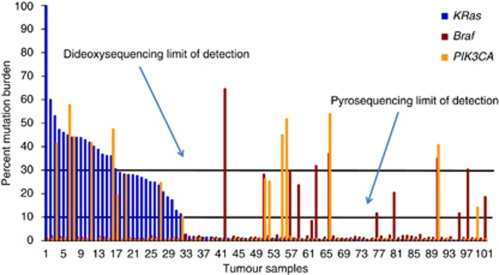
Figure 1.
Inter-tumour variation in K-Ras, B-Raf and PIK3CA mutation burden Quantitative mutation detection was performed by pyrosequencing analysis, as described in the ‘Materials and methods’ section. Inter-tumour differences in mutation burden for K-Ras (blue), B-Raf (red) and PIK3CA (yellow) is illustrated, where each bar represents a different tumour sample. Tumours with K-Ras mutations are grouped to the left, with additional B-Raf and PIK3CA mutations highlighted. Arbitrary limits of detection for pyrosequencing (10% mutation burden) and dideoxy sequencing (30% mutation burden) are illustrated, highlighting the additional mutations identified by pyrosequencing analysis.

