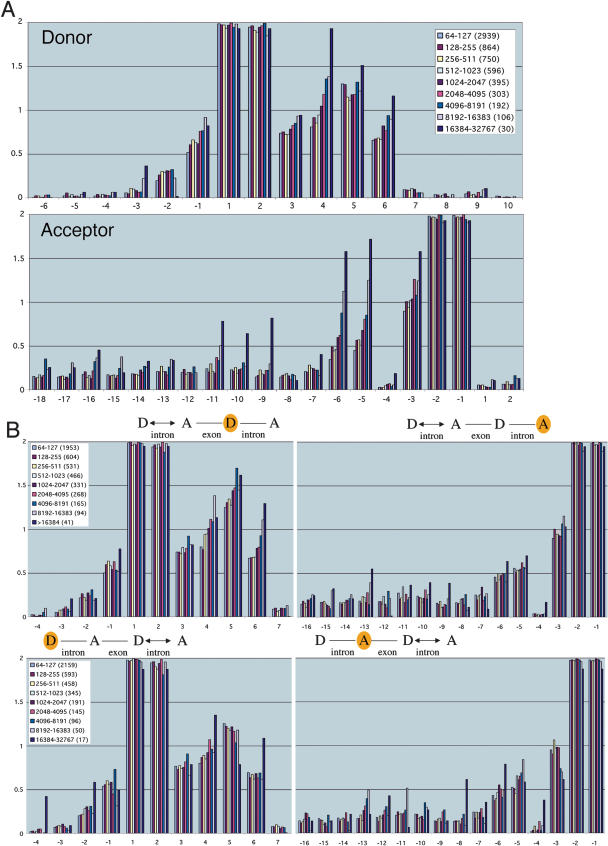
Figure 3.
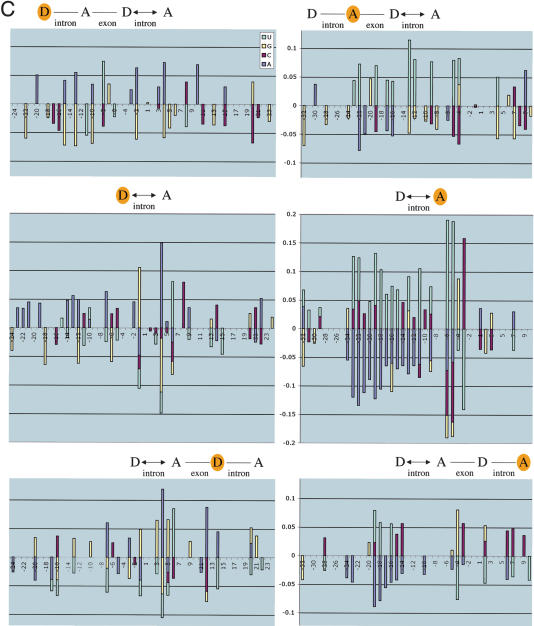
Donor and acceptor sites have increased information in the vicinity of long introns. (A) The graphs show the information profiles for regions around the donor and acceptor sites of nine sets of introns corresponding to progressively larger length ranges. They illustrate that information increases with intron length at characteristic nucleotide positions (see text). Because multiple, consecutive length ranges were analyzed, both pronounced and subtle trends are evident in the graphs. The average standard deviation in information at a nucleotide position is <0.06 bits, except for the range 16,384-32,767 (where it is ∼0.14 bits). (B) The graphs show the information profiles for regions around the donor and acceptor sites of nine sets of introns that immediately follow or precede the introns in the sets used in A. They illustrate that information increases with intron length, but the effects are more pronounced at the donor and acceptor sites closest to the intron varying in length (illustrated with a double arrow). The information is computed at the donor sites (D) and acceptor sites (A) that are shaded yellow. The number of introns in each set is listed in parentheses after each length range. The average standard deviation at a nucleotide position is <0.14 except in the lower panel, where it is ∼0.2 bits for donor and acceptor sites in the range 16,384-32,767. Cumulative information (positions -32 to +32) of donor and acceptor sites of introns preceding or following introns (64-80 nt) is significantly lower than those of introns (>8191; in all cases, p > 0.99 by one-tailed t-test). (C) Changes in nucleotide content at each position were measured for three pairwise comparisons: (i) introns >8191 compared with 64-80; (ii) 4096-8191 compared with 81-127; (iii) 2048-4095 compared with 60-63. The mean of the changes in (i), (ii), and (iii) is illustrated if all three comparisons showed a positive change, or all showed a negative change, and all three changes were significant by a two-tailed t-test (p > 0.99).


