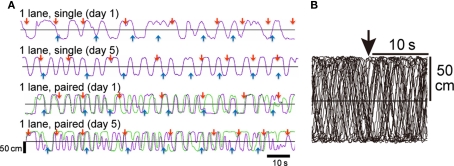
Figure 2.
Representative running trajectories in the 1-lane condition (Experiment 1). (A) Two minutes records of running trajectories. Purple and green lines represent the trajectory of individuals along the long axis of the maze; upward indicates the direction to the red feeder. Red and blue arrows indicate the time at which a grain(s) was delivered. The top and second records (1-lane, single) were obtained from the same chick on different days (days 1 and 5). The third and fourth records (1-lane, paired) were obtained from a pair of individuals. Comparison of the trajectories on day 1 (top vs. third) and day 5 (second vs. fourth) clearly shows that the paired chicks ran at a higher frequency. (B) Thirty superimposed trajectories aligned at the time of grain delivery from the red feeder (downward arrow at the top). An example obtained from a chick tested in the single condition in the maze. Note that the runs were not in response to the food delivery.

