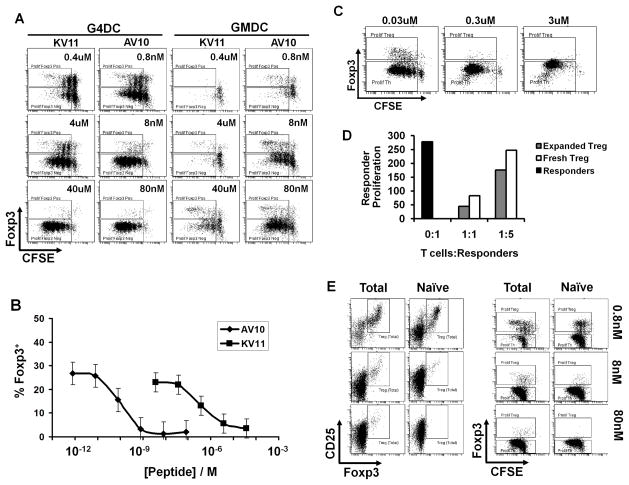
FIGURE 1.
DC presenting low doses of antigen induce and expand suppressive Foxp3+ Treg. A, CFSE-labeled BDC2.5 CD4+ T cells were stimulated for 7d with G4DC or GMDC, plus low-affinity (KV11) or high-affinity (AV10) antigenic peptides at the indicated doses, then stained for CD4 and Foxp3. FACS plots show CFSE and Foxp3 in gated CD4+ T cells. B, Percentage of Foxp3+ CD4+ T cells induced by AV10 and KV11 peptides presented by G4DC. Graph shows mean and standard deviation from three independent experiments. C, CFSE-labelled DO11.10 CD4+ T cells were stimulated for 7d with G4DC plus OVA323 peptide at the indicated doses, then stained for CD4 and Foxp3. D, PKH26-labeled BDC2.5 CD4+ responder T cells were co-cultured for 5 days with CD4+CD25+Foxp3GFP+ BDC2.5 Treg at the indicated ratios. Treg were either freshly isolated or expanded in vitro with G4DC plus low dose AV10. Proliferation of responders was measured by recording PKH26 dilution. Y-axis shows proliferation of gated CD4+GFPNeg responders, represented as 1/MFI PKH26. E, Total or naïve CD4+ BDC2.5 T cells were stimulated for 7 days with G4DC plus AV10 peptide at the indicated doses, then stained for CD4, CD25 and Foxp3. All FACS plots show Foxp3, CD25 and/or CFSE content in gated CD4+ T cells. Data are representative of >3 independent experiments.

