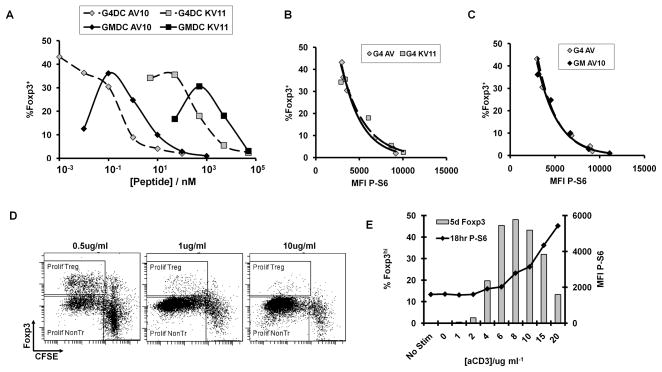
FIGURE 4. Correlation between Ag dose, pS6 and Foxp3 expression.
A–C, CD4+ BDC2.5 T cells were stimulated with G4DC or GMDC, plus high-affinity (AV10) or low-affinity (KV11) peptides, at the indicated doses. T cells were stained at 18hrs for CD4 and intracellular pS6, and at d7 for CD4 and intracellular Foxp3. A, % Foxp3+ cells in CD4+ gate at d7. B and C, pS6 MFI at 18hrs (x-axis) and % Foxp3+ at d7 (y-axis). D and E, CD4+ BDC2.5 T cells were stimulated for with plate-bound anti-CD3 at indicated doses, plus soluble anti-CD28 at 1ug/ml. T cells were stained at 18hrs for CD4 and intracellular Phospho-S6, and at d5 for CD4 and intracellular Foxp3. D, Proliferation and Foxp3 expression in T cells after 5 days of stimulation. E, P-S6 levels at 18hr and % Foxp3 at day5. Data shown in all panels are representative of ≥3 independent experiments.

