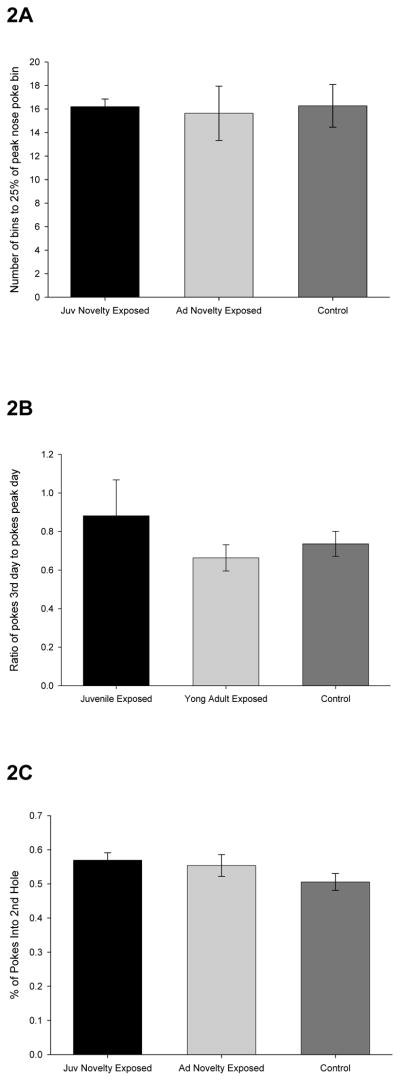
Figure 2. Increases in exploration are not associated with increased rates of habituation.
After exposure to novel environments (which promoted an increase in exploration), rates of habituation were assessed in a nose poke apparatus. A: In the nose poke test (single hole open), number of bins to reach a level of nose poking that was 25% of that attained during initial exposure to the hole is plotted as a function of group. Error bars indicate standard errors. B: In the nose poke test (single hole open), ratio of the slope of the 3rd day to the slope of the peak day(1st or 2nd) plotted as a function of group. Error bars indicate standard errors. C: In the nose poke test (with a second, novel hole open), percent of pokes into the 2nd hole plotted as a function of group. Error bars indicate standard errors.

