Figure 3.
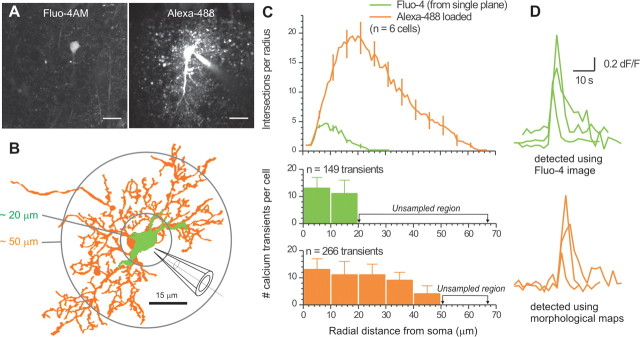
Morphological maps improve detection of calcium transients in astrocyte processes. A, Left, Representative image of an astrocyte loaded with Fluo-4AM (acquired in a single confocal plane). Right, Representative image of the same astrocyte dialyzed with Alexa-488 after the calcium imaging session. Scale bars, 15 μm. B, 2D representation of another astrocyte loaded with Fluo-4 (from one confocal plane; green). A 2D representation of the same astrocyte is shown for the z series after loading with Alexa-488 via the patch pipette (orange). C, Top, Average Sholl plots from reconstructions such as those shown in B. Bottom, Number of calcium transients measured at increasing distances from the soma in 10 μm bins. The green bars correspond to transients measured in one confocal plane from the Fluo-4 image. The orange bars represent transients detected using 2D morphological maps of the Alexa-488 z series: the sampled region was larger, as shown by the circles in B. D, Exemplar calcium transient traces for the two different conditions of analysis indicated.

