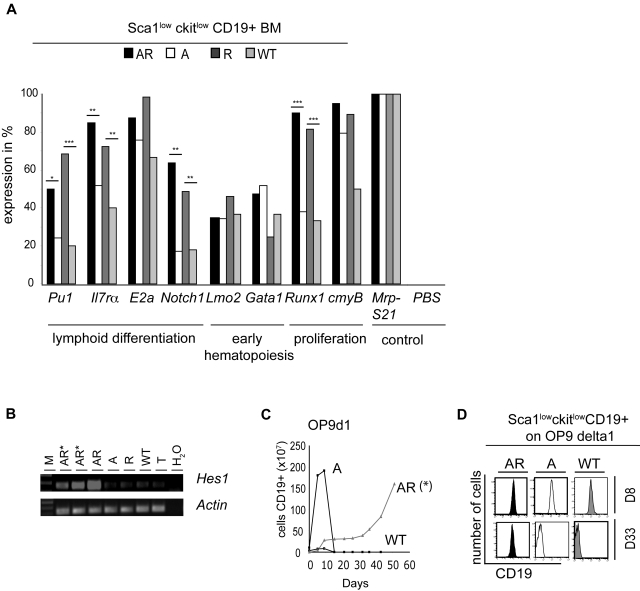
Figure 4.
Transcriptional profiles and the role of Notch–Notch-ligand interaction in the AR and R populations. The AR Sca1lowckitlow CD19+ population was flow-sorted from AR, A, R, and WT BM. (A) Between 30 and 40 single cells (60 for R) from the Sca1lowckitlowCD19+ population from AR (■), A (□), R ( ), and WT (
 ) BM were sorted into 96-well plates. Single-cell RT-PCR analysis was performed for the early hematopoietic genes Lmo2 and Gata1, the B-cell lineage genes Pu1, Il7rα, and E2a, the cell-cycle genes Runx1 and c-myB and the gene for the T-cell transcription factor Notch1. The figure illustrates positive gene expression in terms of the percentage of analyzed cells. Mrp-S21 served as an internal control, PBS-loaded wells with no cells served as a negative control and both controls were run for all primer sets. The data shown come from 2 independent cell preparations and RT-PCR experiments. An asterisk (*) indicates a statistically significant difference. (B) RT-PCR of the prototypic Notch1 target gene Hes1, using equal amounts of cDNA in 2 pro-B-cell tumors AR*, in the healthy FACS-sorted Sca1lowckitlowCD19+ AR, A, R, and WT populations and in the thymus of a WT mouse (T). One of 3 experiments (with 2 independent cell preparations) is shown. (C) Sca1lowckitlowCD19+ populations from AR, A, and WT mice were cocultured on an OP-9 stroma cell line expressing murine Notch-ligand delta1 (OPS-9-Delta1) in the presence of mFlT3L and mIL7. Cells were replated every week for > 40 days. Shown is 1 representative experiment of 2. (D) The histograms show the CD19 expression at days 8 (D8) and 33 (D33). One of 3 representative experiments is shown.

