Figure 1.
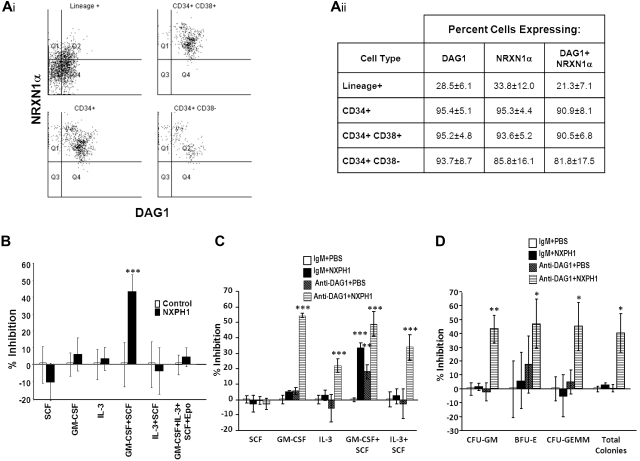
Expression and function of DAG1, NRXN1α, and NXPH in huCB. (Ai) Representative FACS plot of the expression of NRXN1α and DAG1 in huCB populations (For at least 3 independent experiments). (Aii) Chart displaying percentages of huCB populations expressing NRXN1α and DAG1 (combined data from at least 3 independent experiments; mean ± SD). (B) Percent recombinant NXPH1-mediated inhibition of total colony formation in primary huCB cells plated as a population under a variety of factor-stimulated growth conditions (3 combined independent experiments, each done in triplicate; percent inhibition is calculated from the control defined as zero percent inhibition; mean ± SD). (C) Percent recombinant NXPH1-mediated inhibition of CFU-GM colonies produced by huCB-derived HPCs stimulated by specific growth factors, alone or in combination, in the presence and absence of anti-DAG1 blocking Ab when plated in population (combined data from 3 independent experiments performed in triplicate; percent inhibition is calculated from the control defined as zero percent inhibition; mean ± SD). (D) Percent recombinant NXPH1-mediated inhibition of CFU-GM, BFU-E, and CFU-GEMM colonies produced by huCB-derived HPCs stimulated by GM-CSF, IL-3, SCF, and Epo, in the presence and absence of anti-DAG1 blocking Ab when plated in population (combined data from 3 independent experiments performed in triplicate; percent inhibition is calculated from the control defined as zero percent inhibition; mean ± SD). *P < .05, **P < .005, ***P < .0005.

