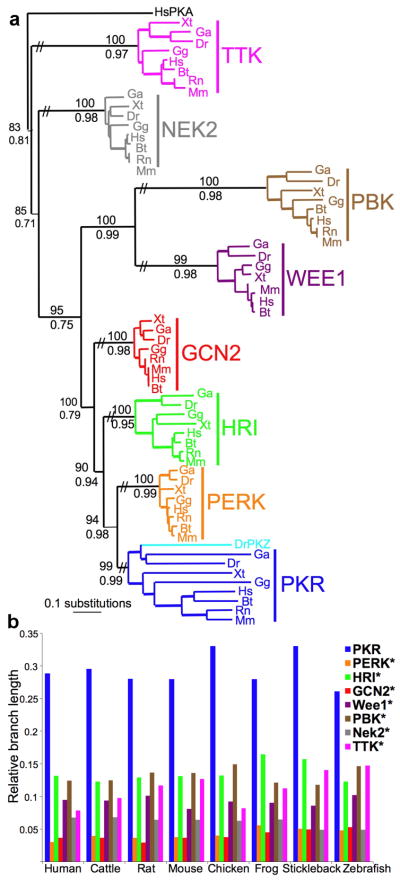
Figure 1. Accelerated evolution of PKR.
(a) Maximum likelihood phylogram of the kinase domains (KDs) of PKR, PERK, HRI, GCN2, WEE1, PBK, NEK2 and TTK from human (Homo sapiens, Hs), cattle (Bos taurus, Bt), mouse (Mus musculus, Mm), rat (Rattus norvegicus, Rn), chicken (Gallus gallus, Gg), frog (Xenopus tropicalis, Xt), stickleback fish (Gasterosteus aculeatus, Ga) and zebrafish (Danio rerio, Dr) [-lnL=12690.22265]. The topology of the Bayesian analysis showed comparable results. Posterior probabilities from the Bayesian analysis and bootstrap values from the maximum likelihood analysis are shown below and above major branches, respectively. (b) Relative branch lengths (from (a)) of KDs in the indicated species. Stars denote significant difference from PKR (P<0.001).

