Fig. X.2.

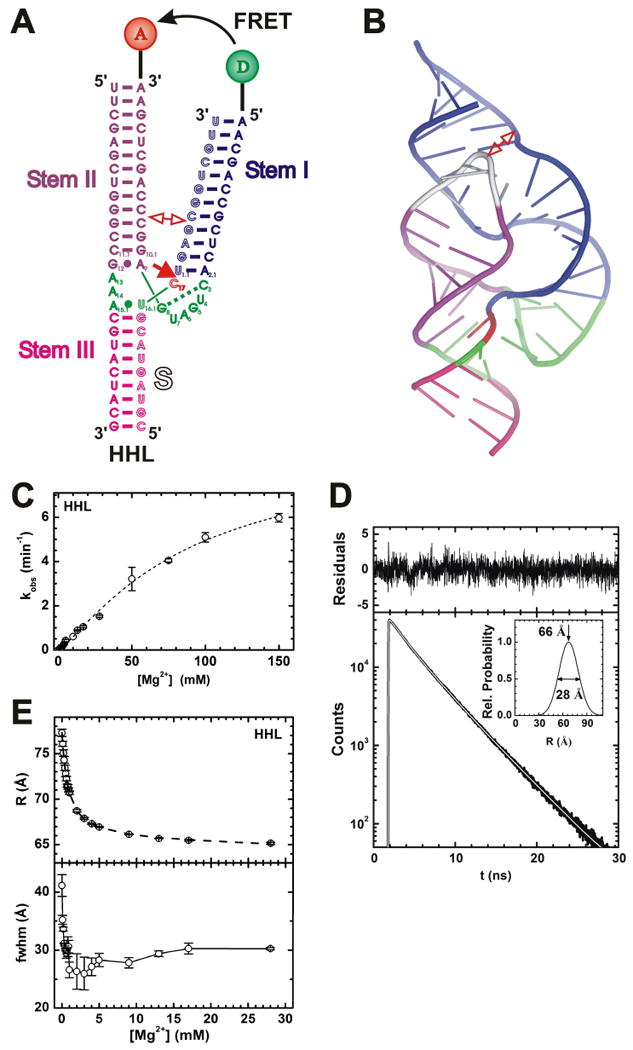
FRET studies of the hammerhead ribozyme. (A) Secondary structure of the hammerhead ribozyme HHL utilized in these studies. Helices are color coded, the catalytic core is highlighted in green, and the cleavage site in the substrate (outlined, S) is marked by a closed red arrow. Stems I and II are labeled with donor (D) and acceptor (A) fluorophores, as indicated, which undergo FRET. In extended forms of the ribozyme, Stems I and II interact in the regions marked by an open double-arrow. (B) Cartoon representation of the crystal structure of the extended Schistosoma hammerhead ribozyme (PDB ID: 2GOZ) (Martick and Scott 2006), color-coded as in panel A except for the silver capping loop that is present only in the extended form. The interaction of an internal and a capping loop in Stems I and II, respectively, is marked by an open double-arrow. (C) Mg2+ dependence of the observed cleavage rate constant of HHL under standard conditions (50 mM Tris-HCl, pH 8.0, 25°C). (D) Representative HHL donor fluorescence decay (bottom, black line) with corresponding fit (white line) in the presence of acceptor under standard conditions with 9 mM Mg2+. Top, fit residuals; inset, resulting single-distance distribution with the indicated mean and fwhm values. (E) Mean distance (top) and fwhm (bottom) of the Stem I-II distance distribution of HHL as a function of Mg2+ concentration under standard conditions, as derived by time-resolved FRET analysis similar to panel D. In part modified with permission from (Rueda et al. 2003).
