
Figure 2.
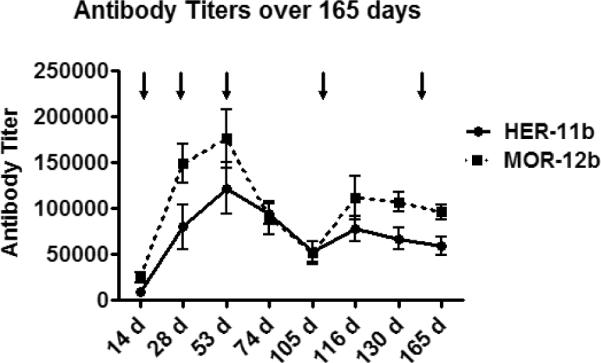
Vaccine titer levels over the course of 165 days. Vertical arrows represent booster injections at t = 14, 28, 53, 108 and 151 days. Data represented are the pooled sera mean value ± SEM.
Official websites use .gov
A
.gov website belongs to an official
government organization in the United States.
Secure .gov websites use HTTPS
A lock (
) or https:// means you've safely
connected to the .gov website. Share sensitive
information only on official, secure websites.
Vaccine titer levels over the course of 165 days. Vertical arrows represent booster injections at t = 14, 28, 53, 108 and 151 days. Data represented are the pooled sera mean value ± SEM.