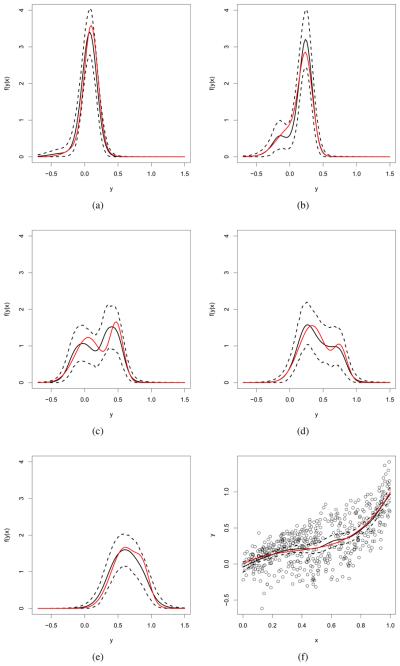
Figure 1.
Simulated data - WDDP model: True conditional densities of y|x (in red), posterior mean estimates (black continuos line) and point-wise 95% HPD intervals (black dashed lines) for: (a) x = 0.1, (b) x = 0.25, (c) x = 0.48, (d) x = 0.76, and (e) x = 0.88. Panel (f) shows the data, along with the true and estimated mean regression curves.

