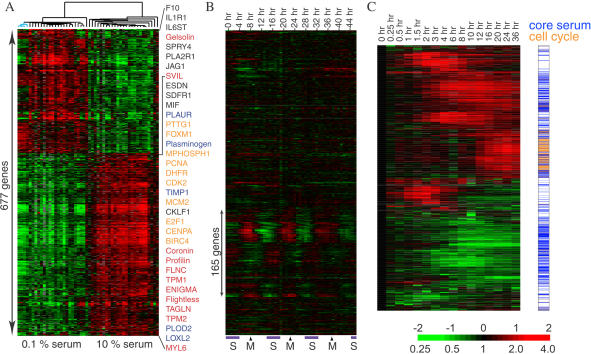
Figure 1. Identification and Annotation of a Common Serum Response in Fibroblasts.
(A) The fibroblast common serum response. Genes with expression changes that demonstrate coordinate induction or repression by serum in fibroblasts from ten anatomic sites are shown. Each row represents a gene; each column represents a sample. The level of expression of each gene in each sample, relative to the mean level of expression of that gene across all the samples, is represented using a red–green color scale as shown in the key; gray indicates missing data. Representative genes with probable function in cell cycle progression (orange), matrix remodeling (blue), cytoskeletal rearrangement (red), and cell–cell signaling (black) are highlighted by colored text on the right. Three fetal lung fibroblast samples, cultured in low serum, which showed the most divergent expression patterns among these samples (in part due to altered regulation of lipid biosynthetic genes [Chang et al. 2002]), are indicated by blue branches.
(B) Identification of cell cycle-regulated genes in the common serum response signature. The expression pattern of each of the genes in (A) during HeLa cell cycle over 46 h after synchronization by double thymidine block is shown (Whitfield et al. 2002). Transit of cells through S and M phases during the timecourse, verified by flow cytometry, is indicated below. Approximately one-quarter of genes demonstrate a periodic expression patterns and are therefore operationally annotated as cell cycle genes; the remainder of the genes are used in further analyses to define the CSR.
(C) Validation of annotation by temporal expression profiles. Timecourse of gene expression changes in a foreskin fibroblast culture after shifting from 0.1% to 10% FBS is shown. Global gene expression patterns were determined using cDNA microarrays containing 36,000 genes; genes whose transcript levels changed by at least 3-fold during the timecourse and those in (A) are displayed. The cell cycle genes identified in the analysis illustrated in (B) were found to have a distinct temporal expression pattern with coordinate upregulation at 12 h.

