Figure 6.
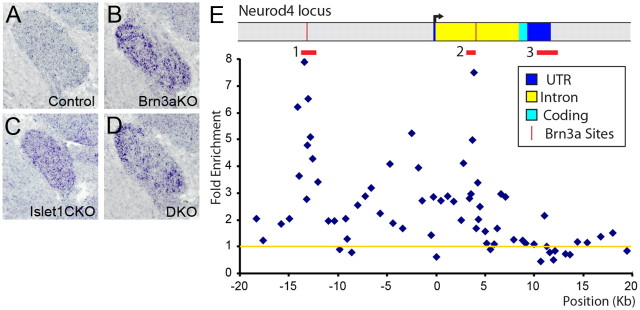
Chromatin immunoprecipitation of Islet1 bound to the Neurod4 locus. A–D, In situ hybridization for Neurod4 mRNA in the E13.5 TG. The normal developmental decline in expression observed in the WT TG fails to occur in Brn3a KO, Islet1 CKO or DKO ganglia. E, ChIP was performed using formalin-fixed E11.5 TG and a polyclonal Islet1 antibody (see Materials and Methods). Quantitative PCR was performed using oligonucleotide primer sets spaced at intervals of 0.5–1 kb across the locus (Lanier et al., 2007), and enrichment of the selected over an unselected control sample was analyzed by the cycle threshold method (Livak and Schmittgen, 2001). The fold enrichment relative to input chromatin was normalized to the average of five control sites in the Alb1 (serum albumin) locus, which is not expressed in sensory neurons, as shown by the yellow line (1-fold enrichment). Islet1 ChIP showed two regions of specific selection: in the 5′ UTR −14 to −13 kb upstream and in the single intron 3.2–3.8 kb downstream from the start of transcription (region 1 and region 2, designated by red bars). Mean folds of two selections for each primer pair are shown. The enrichment maxima occurred at −13,397 and +3888. T tests using 3–6 PCR primer pairs and two independent selections were used to assess the significance of enrichment for these regions compared to a control region 3′ to the transcription unit (region 3). Region 1 versus region 3 enrichment, p = 2.4 × 10⁻⁶; region 2 versus region 3 enrichment, p = 4.5 × 10⁻⁵. Region 3 versus alb (albumin) locus, p = 0.85, 0.94 (n.s.). The regions of selection by Islet1 correspond closely to conserved enhancer elements containing known Brn3a binding sites (Lanier et al., 2007).

