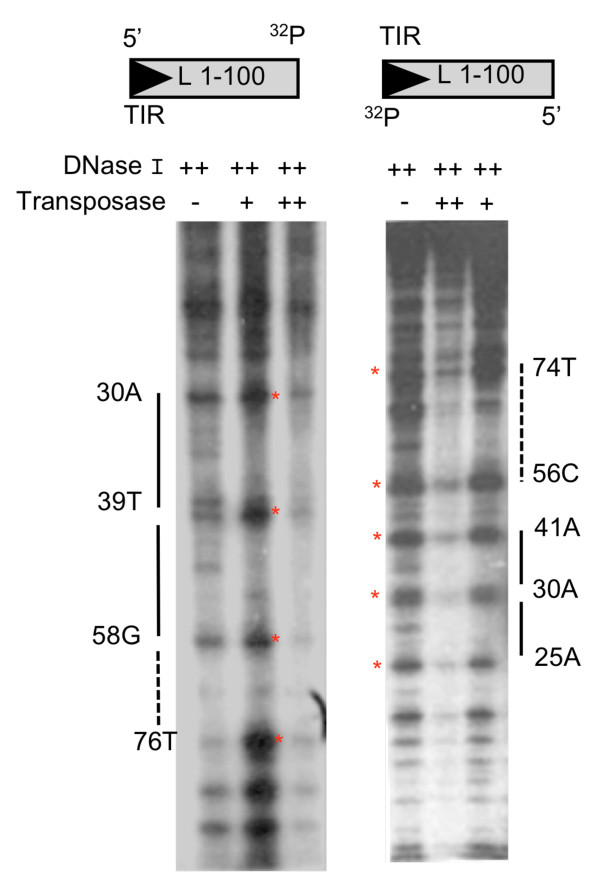
Figure 3.
Transposase binding analysis to the Herves-left (L) end. The single-end-labeled Herves-L 1-100 bp fragment (100 nM) was incubated in presence (+, ++) or absence (-) of DNase I or the transposase. The ++ indicates 1.4 μM of transposase or 0.2 units of DNase I, whereas + indicates 850 nM of transposase or 0.1 units of DNase I. 32P indicates the position where probe was labeled. The solid bars indicate regions protected by the transposase from DNase I degradation. The red asterisk (*) indicates hypersensitive sites.

