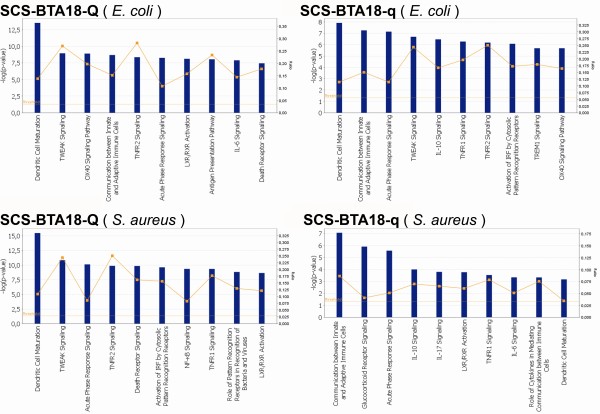
Figure 5.
Overview canonical pathways. Ingenuity canonical pathways affected during time-course between inoculated and control cells in SCS-BTA18-Q and SCS-BTA18-q cells inoculated with E. coli and S. aureus, respectively; blue bars indicate p-value significance and the orange threshold line indicates the p ≤ 0.05 significance thresholds; orange squares and lines indicate the ratio of genes found to be involved in the specific pathway to the overall number of genes involved in that pathway.

