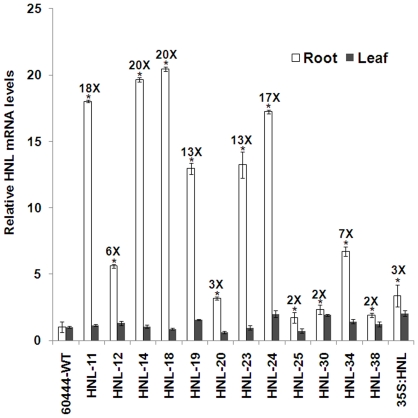
Figure 1. Overexpression of HNL in cassava roots.
Relative expression levels (Q-RT-PCR) of HNL in twelve independent patatin promoter and 35S promoter HNL transgenic line. Tissues (both roots and leaves) were collected at 1.5 month old in vitro stage. HNL expression was compared and normalized to tubulin. Wild type expression values were adjusted to a value of 1 and all other expression values were normalized relative to this tissue. The number above the white bars (roots) indicates the fold increase compared to wild type. Error bars represent SE of three biological replicates. The asterisk (*) indicates statistically significant differences between wild-type and transgenics, determined by Student's t-test, with P<0.05.

