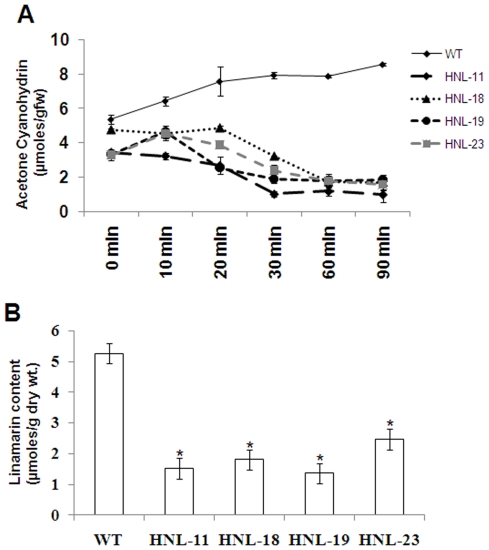
Figure 4. Overexpression of HNL decreases cyanide levels in transgenic roots.
(A). Acetone cyanohydrin levels were measured using seven month old root cortex tissues assayed at different time intervals post-homogenization. Data are presented as the amount of acetone cyanohydrin levels calculated as the difference between the two assays {(acetone cyanohydrin + cyanide assay) – (cyanide assay)}. Error bars indicate SE of the mean of three biological replicates. (B). GC-MS quantification of root linamarin contents in wild-type and transgenic plants. Samples were normalized with internal standard phenyl β-glucopyranoside (PGP). Linamarin content is expressed as µmoles per gram dry weight. Error bars indicate SE of the mean of four biological replicates. The asterisk (*) indicates statistically significant differences between wild-type and transgenics, determined by Student's t-test, with P<0.05.

