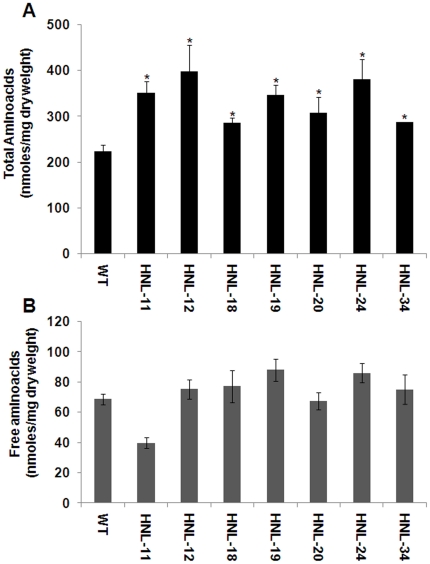
Figure 5. Total and free amino acid content of transgenic and wild-type cassava roots.
(A) Measurement of total protein hydrolyzed and free amino acid concentrations in transgenic and wild-type roots. Samples were hydrolyzed with HCl and subjected to ACQUITY UPLC® System. Data are presented as nmoles/mg total dry weight. Error bars indicate SE of the mean of two biological replicates. The asterisk (*) indicates statistically significant differences between wild-type and transgenics, determined by Student's t-test, with P<0.05. (B) Measurement of free amino acid concentrations of transgenic and wild-type roots. Data are presented as nmoles/mg total dry weight of tissue. Error bars indicate SE of the mean of two biological replicates.

