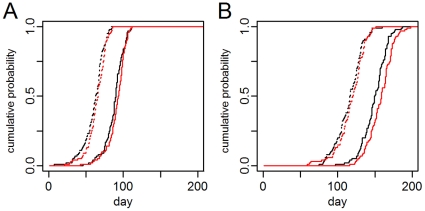
Figure 2. Timing of first autochthonous human infection: migration vs. traveler model.
Each line is the empirical cumulative probability (for 100 simulations) of the first autochthonous transmission event in a single city in a single model. The dotted lines are for a city closely connected to the origin city for the traveler (black) and migration (red) models. The solid lines are for a more distal city. A. is the directly transmitted pathogen and B. is the vector-borne pathogen.

