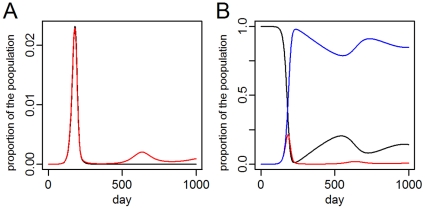
Figure 3. Epidemic recurrence in the city where the epidemic originates.
A. The mean proportion of the population newly infected per day for the traveler (black) and migration (red) models. The pathogen only persists in the migration model and causes a second outbreak approximately two years after the first. B. The mean proportion of the population susceptible (black), incubating and infectious (red), and recovered (blue) in the migration model over time. Approximately 20% of the population is replaced by incoming susceptibles between the two epidemics.

