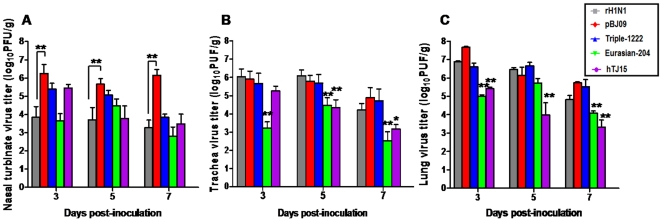
Figure 3. Viral replication in nasal turbinates (A), trachea (B) and lung (C) of mice.
Groups of three BALB/c mice were intranasally inoculated with 104.0 PFU of each virus. Titers of virus recovered from the supernatant of homogenized nasal turbinates, trachea and lung on days 3, 5 and 7 p.i. are shown. Results represent the average titers from the tissues of three infected mice per group. The limit of virus detection was 100 PFU/g. ** in Fig. 3A indicates the significant difference between rH1N1 and pBJ09 viruses (P<0.01; ANOVA). * and ** in Fig. 3B and C indicates the replication titers of Eurasian-204 or hTJ15 are significantly different from those of rH1N1, pBJ09 and Triple-1222 viruses (* is with P<0.05, ** is with P<0.01; ANOVA).

