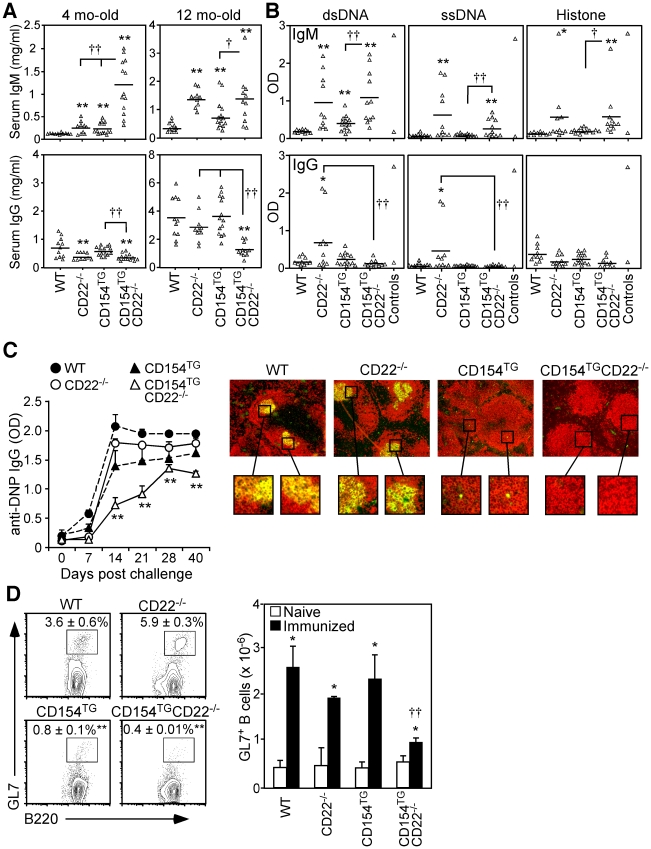
Figure 2. Impaired IgG and GC responses in CD154TGCD22−/− mice.
(A) Serum IgM and IgG levels of 4 and 12 mo-old WT, CD22−/−, CD154TG, and CD154TGCD22−/− mice. Symbols represent serum concentrations for individual mice as determined by ELISA, with means indicated by horizontal bars. (B) Serum autoAbs reactive with dsDNA, ssDNA, or histone proteins in 12 mo-old mice. ELISA OD values for IgM (upper panels) and IgG (lower panels) autoAbs are shown for individual mice, with means indicated by horizontal bars. Sera from 2 mo-old WT C57BL/6 and 6 mo-old MLRlpr mice were used as negative and positive controls, respectively. (C) Impaired IgG responses to a TD Ag. WT (n = 3), CD22−/− (n = 4), CD154TG (n = 6), and CD154TGCD22−/− (n = 8) mice were immunized with DNP-KLH in adjuvant on day 0, and boosted on day 21. The graph shows mean (±SEM) DNP-specific IgG levels as determined by ELISA. Images on the right represent immunofluorescence staining of frozen spleen sections from all genotypes harvested 7 days after the boost phase of DNP-KLH immunization. Merged images show the presence of B220+ B cells (red) and GC GL7+B220+ B cells (yellow). Enlarged regions from these sections indicate typical GC structures present within the follicles of WT and CD22−/− mice, and detectable GL7+B220+ B cells within the follicles of CD154TG mice, but not in CD154TGCD22−/− mice (representative regions are shown for comparison). (A–C) Means significantly different from WT are indicated by asterisks (*p≤0.05, **p≤0.01), and between other indicated groups by crosses (†p<0.05, ††p<0.01). (D) Reduced GC B cells in CD154TGCD22−/− mice as quantified by flow cytometry analysis. Mice were immunized with NP-CGG in alum, with spleens analyzed for GL7+B220+ B cells on day 10. Contour plots show mean (±SEM) GL7+ cell frequencies among total B220+ cells from n = 3 mice of each genotype. Bar graphs show mean (±SEM) GL7+ B cell numbers from naive (open bars) and immunized (filled bars) mice. In the contour plots, mean B10 cell frequencies significantly lower than those of WT mice are indicated by asterisks (**p≤0.01). In the bar graphs, means significantly different between naïve and immunized mice of the same genotype are indicated by asterisks (*p≤0.05); crosses for CD154TGCD22−/− mice indicate that mean GL7+ cell numbers were significantly reduced relative to all other genotypes (††p<0.01).

