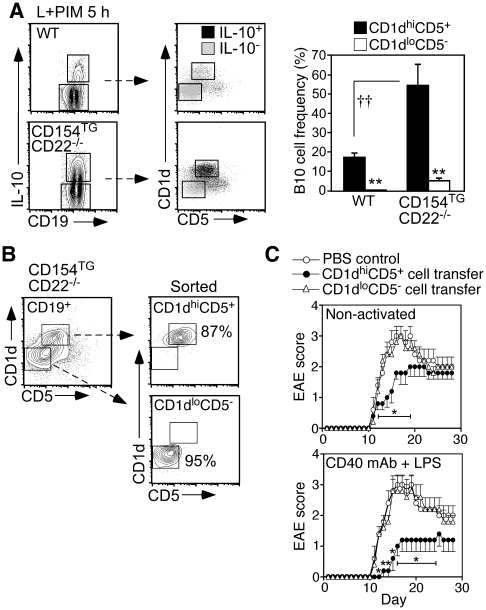
Figure 4. CD154TGCD22−/− B10 cells are regulatory.
(A) B10 cells in CD154TGCD22−/− mice are found predominately within the spleen CD1dhiCD5+ B cell population. Splenocytes from WT and CD154TGCD22−/− mice were cultured for 5 h with L+PIM to induce IL-10 expression, with the cells analyzed for cell surface CD19, CD1d and CD5, and intracellular IL-10 expression. CD19+IL-10+ and CD19+IL-10− B cells (left panels, gated regions) were further gated to show relative CD1d and CD5 expression (merged dot plots, right panels). Bar graphs show the mean (±SEM) B10 cell frequencies within the indicated populations for ≥4 mice of each genotype based on the gated regions indicated in the merged dot plots. Mean B10 cell frequencies significantly different between cell populations from the same genotype are indicated by asterisks (**p≤0.01), and for the same population between genotypes by crosses (††p<0.01). (B) Analysis of CD154TGCD22−/− spleen B cell purity within the CD1dhiCD5+ (B10-rich) and CD1dloCD5− populations following cell sorting of splenocytes stained for CD19, CD1d and CD5. These cells were subsequently used for the adoptive transfer experiments described in (C). (C) B10 cells from CD154TGCD22−/− mice reduce EAE disease severity. Purified CD1dhiCD5+ or CD1dloCD5− spleen B cells from naïve CD154TGCD22−/− mice (B) were either adoptively transferred into WT recipient mice immediately (non-activated) or were cultured with agonistic CD40 mAb for 48 h with LPS added during the final 5 h of culture before transfer. Other recipient mice received PBS alone (Control). One day after cell transfers, EAE was induced by MOG immunization. Values represent mean (±SEM) clinical EAE scores from 5 mice per group, with significant differences from PBS control mice indicated: *p<0.05.

