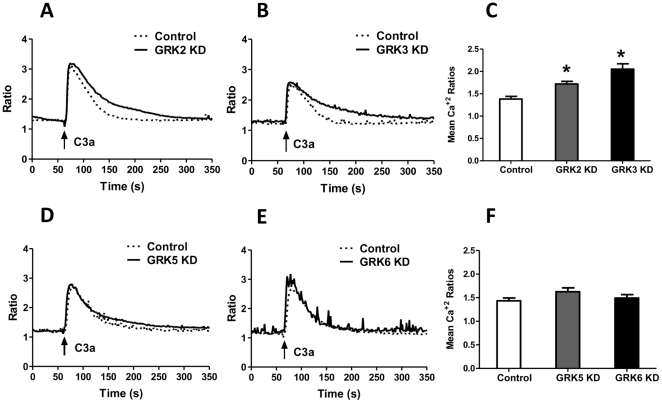
Figure 2. Effects of GRK2/3 and GRK5/GRK6 knockdown on C3a-induced Ca2+ .
mobilization in human mast cells. GRK knockdown (KD) and shRNA control HMC-1 cells were loaded with Indo-1 (1 µM) and Ca2+ mobilization in response to C3a (100 nM) was performed as described in the materials and methods. (A) and (B) show Ca2+ responses in GRK2 and GRK3 KD cells. (C) shows peak Ca 2+ mobilization at 150–200 sec after stimulation. (D) and (E) show Ca 2+ responses in GRK5 and GRK6 KD cells. (F) shows peak Ca2+ mobilization between 150 and 200 sec after stimulation. For experiments in (A), (B), (D) and (E), representative traces from three independent experiments are shown. For (C) and (F) data represent the mean ± SEM from three independent experiments. Statistical significance was determined by unpaired two-tailed t test. *, p<0.05.

