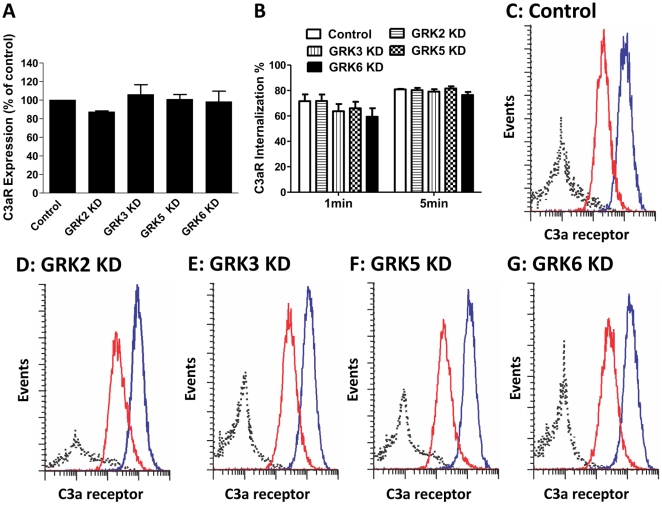
Figure 5. Effects of GRK2/3 and GRK5/6 knockdown on cell surface C3aR expression and agonist-induced receptor internalization.
(A) Control shRNA, GRK2, GRK3, GRK5, and GRK6 KD cells were incubated with a mouse anti-C3aR antibody or an isotype control antibody followed by PE-labeled donkey anti-mouse IgG antibody and analyzed by flow cytometry. Cell surface C3aR in each GRK KD cells is shown as a percent of receptor expression in shRNA control cells. (B) shRNA control and cells with knockdown of each GRKs were exposed to buffer or C3a for 1 min or 5 min and cell surface C3aR expression was determined by flow cytometry. Internalization is expressed as percent loss in receptor expression following exposure to C3a. Data represent the mean ± SEM from three independent experiments. (C–G) Representative histogram plots from an internalization experiment following 5 min exposure to buffer (blue line) or C3a (red line) in shRNA control or GRK KD cells are shown.

