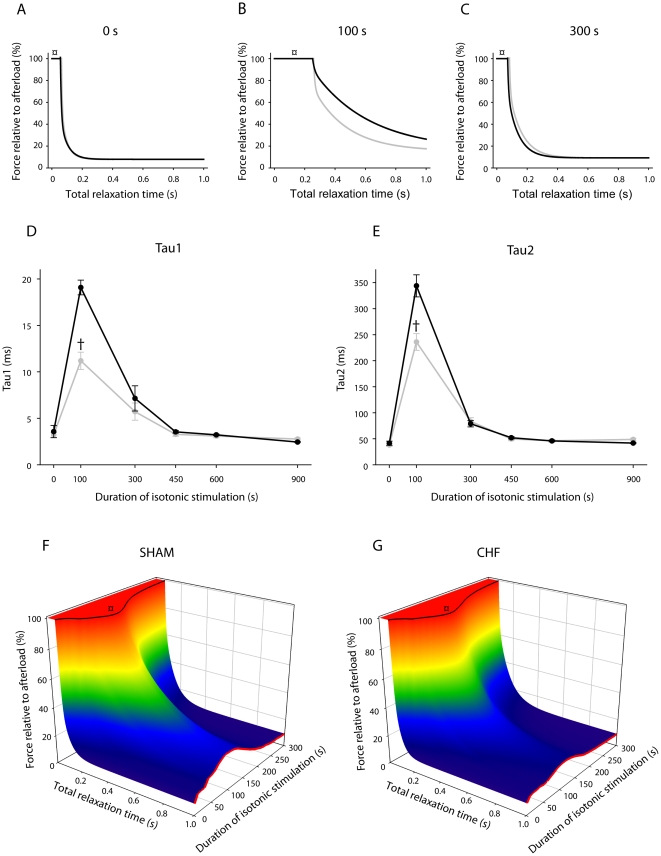
Figure 3. Isometric force decline.
A, B and C: Representative tracings of the isometric relaxation curves after 0 s (A), 100 s (B) and 300 s (C) of the exercise protocol. Note the time lag before force decline starts (marked with ¤) due to time required for relengthening. The transient slowing of isotonic relengthening peaked after 100 s of stimulation (confer Figure 2C and 3F and G). Sham in black and chf in gray. D and E: Time constants (tau1 (D) and tau2 (E), average values for sham (n = 22) and chf (n = 24)) from the isometric force decline at 0, 100, 300, 450, 600 and 900 s of stimulation calculated from a fitted biexponential decay curve. Error bars are ± SEM. Sham in black and chf in gray. †p<0.05 vs. sham. F and G: Averaged force recordings (y-axis) during the period of relaxation (isotonic and isometric phases, x-axis), assembled for the first 5 min of exercise (z-axis) for sham (F, n = 22) and chf (G, n = 24). The time period for relengthening before force decline starts is indicated (black line marked with ¤, confer same symbol in panel A, B and C). Tbl is indicated with a red line. Note the transient rise after 100 s in both groups (confer Figure 2B and 3A, B and C). Since there is no difference between the two groups regarding the isotonic relengthening (black line, F and G (¤)), the attenuated increase in Tbl in chf compared to sham after 100 s (red line, F and G) is due to differences in the isometric force decline.

