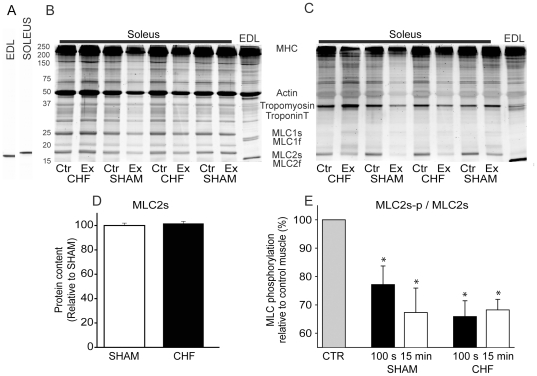
Figure 4. MLC phosphorylation.
A, Representative immunoblot of extensor digitorum longus (EDL) and Soleus probed with monoclonal MLC2 antibody. B, Total protein, stained with SYPRO Ruby for total protein content. C, Same gel as in panel B stained with Pro Q Diamond for phosphorylated proteins. D, Spot density in MLC2s in sham and chf animals related to spot density in sham animals. E, MLC2 phosphorylation in resting (CTR) and exercising SOL normalized to the resting control muscle. Two time points during exercise (100 s and 15 min) were investigated. Average data, sham (100 s and 15 min, n = 5) and chf (100 s and 15 min, n = 15). Bars are + SEM. *p<0.05 vs. CTR.

