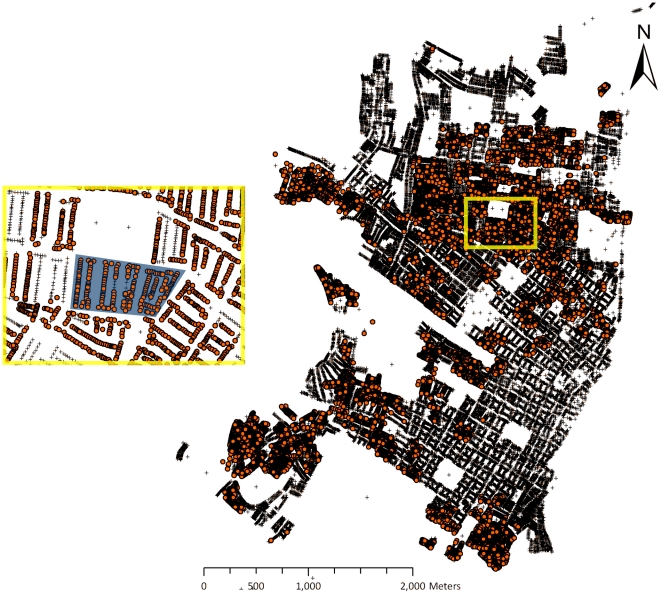
Figure 2. Selection of the 153-house simulation set.
Right: entire city of Iquitos. Each ‘+’ symbol represents an individual house referenced in the GIS map [20], [22]. Orange circles are houses that have been included in at least one survey circuit during the period considered in this study. Inset: a zoomed-in view of part of the Maynas district (delimited in yellow). Our selected block of houses constituting the simulation set is shown as the shaded region in the inset.

