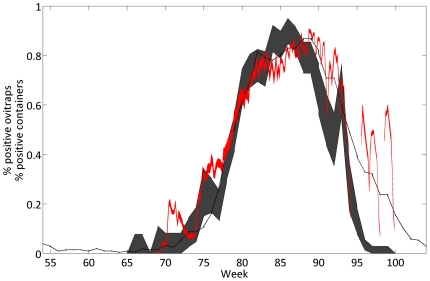
Figure 7. Application of Skeeter Buster to the Mataderos neighborhood in Buenos Aires, Argentina.
Time series presented here are from the beginning of July 2001 (week 52) to the end of June 2002 (week 104). Shaded dark gray area: observed fraction (95% CI) of positive ovitraps in a weekly field monitoring [40], [41]. Black line: outcome of Otero et al. [12] stochastic spatial model. Shaded red area: Skeeter Buster simulation results (95% CI of 20 replicated simulations) using container data obtained from Iquitos (see text). Discontinuities in the red area correspond to weeks during which no positive container was observed in the model.

