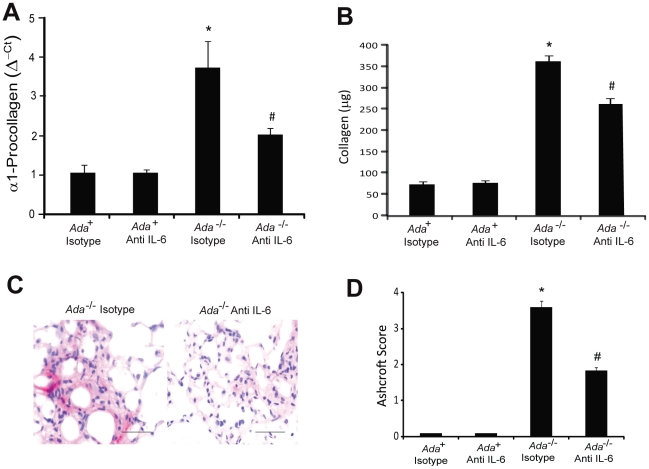
Figure 4. Attenuation of pulmonary fibrosis following IL-6 neutralization.
(A) Decreased collagen production. Whole-lung α1-procollagen transcript levels were measured in RNA extracts from day 43 lungs using quantitative RT-PCR. Transcripts were measured in parallel with 18S rRNA and values are presented as mean normalized transcript levels (Δ−ct) ±SEM, n = 6. (B) Soluble collagen levels were measured using the Sircol assay and data presented as mean µg collagen/ml BAL fluid ±SEM, n≥8. (C) Lung sections were stained with an antibody against α-sma to visualize myofibroblasts (pink). Images are representative of 6 animals from each group. Scale bars: 100 µm. (D) Ashcroft scores were used as a morphometric approach to quantify overall fibrosis in the lungs, n = 6 per group. *, p≤0.05 Ada + vs Ada -/- and #, p≤0.05 Ada -/- vs Ada -/- + Anti-IL-6.

