Figure 3.
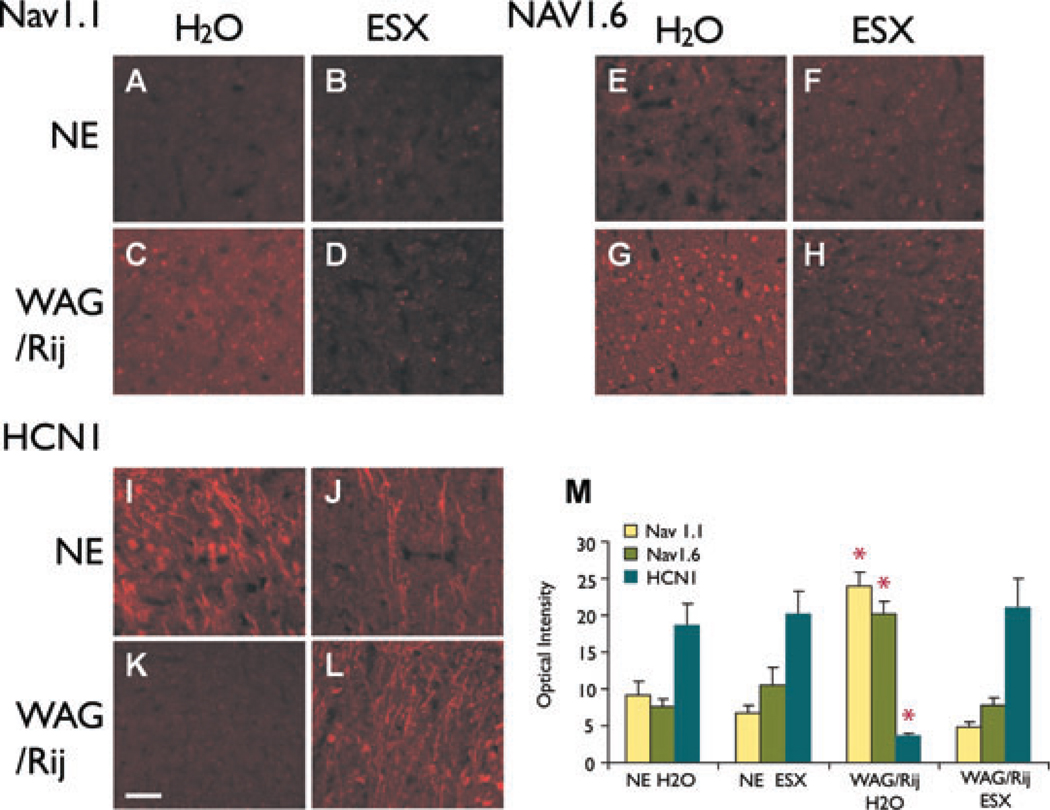
Early ethosuximide treatment blocks changes in ion channel expression (Experiment 1). (A–L) Examples of immunocytochemistry for Nav1.1 (A–D), Nav1.6 (E–H), and HCN1 (I–L) in somatosensory cortex layers II–III. (A–D) Nav1.1 is increased in WAG/Rij rats on normal drinking water (H2O) (C). The increase in Nav1.1 is blocked in WAG/Rij rats treated with early ethosuximide (ESX) (D). Nav1.1 expression in treated animals (D) resembles nonepileptic (NE) control animals (A, B). (E–H) Nav1.6 is increased in WAG/Rij rats on H2O (G). The increase in Nav1.6 is blocked by early ESX treatment (H), producing levels that resemble NE controls (E, F). (I–L) HCN1 is decreased in WAG/Rij rats on H2O (K). The decrease in HCN1 is blocked by early ESX treatment (L), producing levels that resemble NE controls (I, J). (M) Quantitative optical density changes in immunocytochemistry for Nav1.1, Nav1.6, and HCN1 in somatosensory cortical layer II–III neurons. Epileptic WAG/Rij rats on H2O have increased expression of Nav1.1 and Nav1.6, and decreased expression of HCN1. Expression levels for these channels were significantly different in the WAG/Rij H2O group compared to all other groups (WAG/Rij H2O group vs. NE H2O, NE ESX and WAG/Rij ESX, respectively, F = 36.75, 38.62, 44.32; p = 1.07 × 10⁻⁹, 6.36 × 10⁻¹⁰, 9.09 × 10⁻¹¹, d.f. = 2, between groups ANOVA for all three channels; *p < 0.01, post hoc between-group comparisons for each individual channel, Bonferroni corrected), and the other three groups did not differ significantly from each other (F = 0.24, p = 0.79, d.f. = 2). Images shown in A–L were equivalently enhanced (i.e., the identical brightness and contrast enhancements were made to each picture) to help demonstrate the differences in a way that would be clear in a printed format. For quantification (M), raw unenhanced images were used. Scale bar (K, applies for all panels) = 50 µm.
Epilepsia © ILAE

