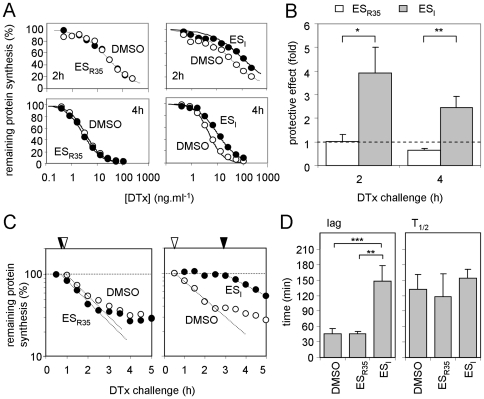
Figure 5. ESI treatment protects cells from DTx challenge.
A. Typical single cytotoxicity profiles of DMSO, ESI and ESR35 treated HeLa cells subsequently challenged with graded doses of DTx for 2 (upper) or 4 h (lower). B. Protective effect of the drugs, determined from assays in A. n = 3, +/− 1.S.D. Protective effects from ESI and ESR35 treated cells were compared using an unpaired t-test (2 h, p = 0.0104, t = 4.555; 4 h, p = .00024, t = 6.858; *, significant: **, very significant). C. Typical single assays showing the temporal profile of DTx cytotoxicity to cells treated with DMSO, ESI or ESR35, and determination of the lag phase (dotted lines and arrowheads, coded as in Figure 3C). D. Lag phases and half-lives of protein synthesis (T1/2) were determined. DMSO, n = 6, +/− 1.S.D., ESI and ESR35, n = 3, +/− 1 S.D. Values were compared using unpaired t-tests. Lags: DMSO versus ESR35, no significant difference; DMSO versus ESI, p<0.0001, t = 8.810; ESI versus ESR35 p = 0.0028, t = 6.573; **, very significant: ***, extremely significant. T1/2 values: no significant differences.

