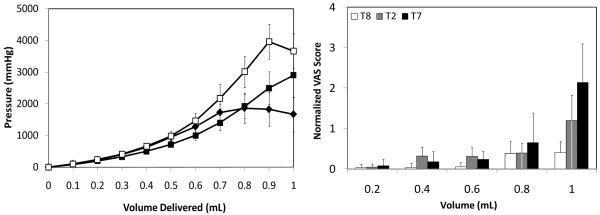
Figure 4.
Effect of infusion flow rate on (a) infusion pressure and (b) pain score as a function of infusion volume. Microneedles were inserted into the skin at 750 μm and saline was infused at rates of T8 = 0.1 mL/min (◆), T2 = 0.3 mL/min (■), and T7 = 1 mL/min (□). Visual analog score (VAS) for pain was normalized relative to the pain caused by intradermal insertion of the hypodermic needle. Data are the average of 10 replicates expressed as mean ± SD.

