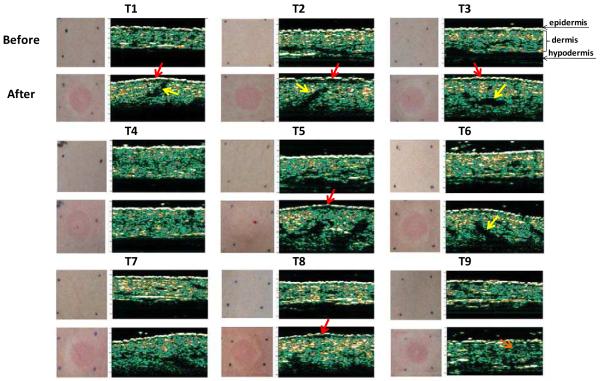
Figure 9.
Photographs and ultrasound echographs of skin before and after microneedle-based infusion. For each treatment (as defined in Table 1), the upper pair of images displays a photograph of the skin surface (on the left) and an echograph of the skin thickness (on the right) taken before infusion. The lower pair of images displays a photograph of the skin surface immediately after infusion (on the left) and an echograph of the skin thickness ~5 min after infusion (on the right). The bright white line on the top of the echographs represents the epidermis; the green layer below it depicts the dermis; and the black region below the dermis is hypodermis. The regions of red and yellow in the dermis represent areas of higher acoustic reflection corresponding to denser tissue. Red arrows indicate black space between epidermis and dermis with low acoustic reflection, which are believed to correspond to saline pools. Yellow arrows indicate black spaces corresponding to possible saline pools within the dermis.

