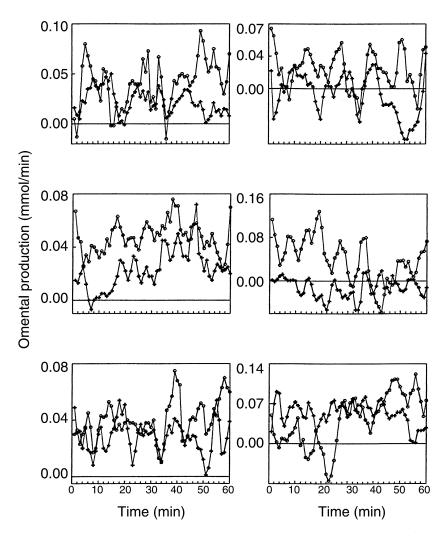
Figure 2.
Omental production of FFA (circles) and glycerol (plus symbols). Six representative dogs are shown during 1-minute sampling for 1 hour. Data are shown as mean ± SD. Omental production was calculated from direct measurements taken simultaneously from the portal vein and carotid artery (see the text).

