
Figure 4.
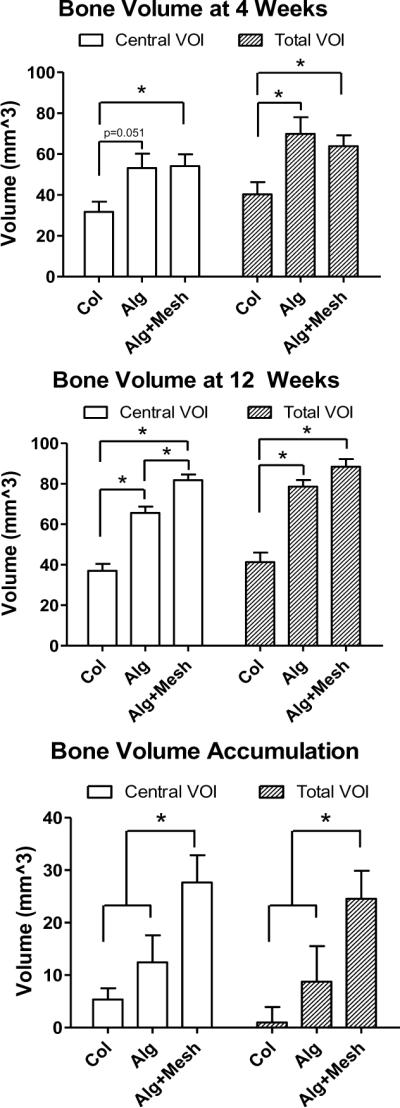
Quantitative μCT analysis of new bone volume. The Alg and Alg+Mesh groups had significantly higher bone formation than the Col group at both time points in the total VOI. At 12 weeks, the Alg+Mesh group possessed more bone in the central VOI region than the Alg group, consistent with the three-dimensional images. The Alg+Mesh group also saw the largest increase in the bone volume between 4 and 12 weeks. * indicates significantly different (p<0.05). n = 9–10 defects per group. Results are presented as mean±SEM.