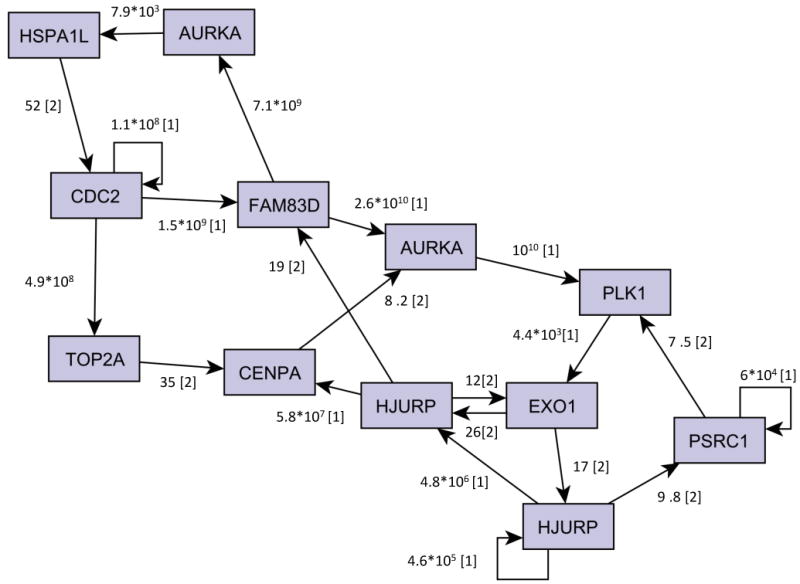
Figure 6. Assessment of the robustness of the inferred feedback loops.

The Figure shows the relationships between the loop nodes annotated with the corresponding BF. In cases in which a gene has two parents, the BF of the first added parent (BF10) is indicated with [1] and that of the second parent (BF21) with [2].
