
Figure 1.

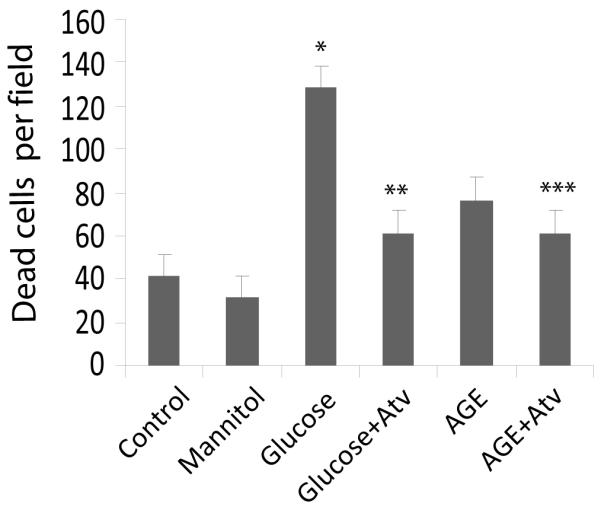
Cell growth and morphologic changes of HUVEC treated with high glucose and AGE. HUVE cells were treated for 24h with A: PBS control; B: high mannitol control (30 mmol/L); C: high glucose (30 mmol/L); D: high glucose + atorvastatin (12 mg/L); E: high AGE (400 μg/ml); F: high AGE with atorvastatin (12 mg/L); G: Cell death in each treatment group (quantitated as dead cells/microscopic field). Data are expressed as mean ± SD in each group. * compared with the control group, P<0.05; ** compared with the high glucose group, P<0.05; *** compared with the AGE group, P=0.5. Photos were taken 24 hours after treatment. (Dead cells are shown in yellow).