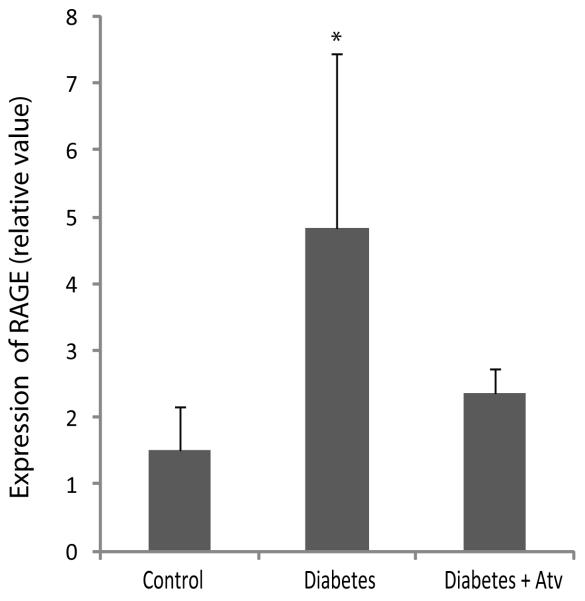
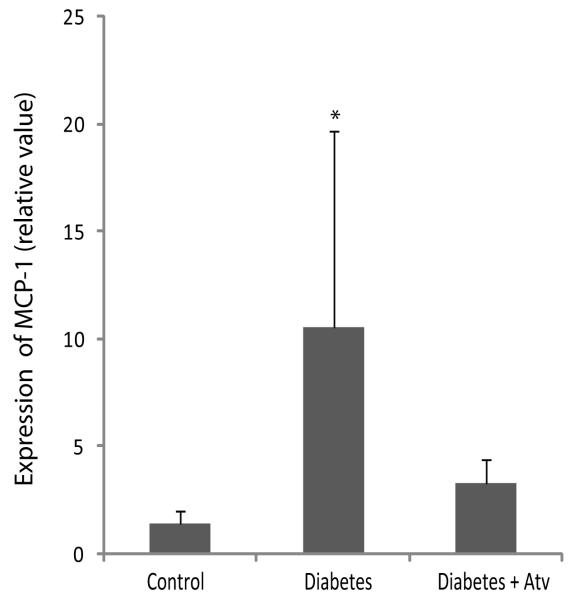
Figure 4.
Atorvastatin downregulated RAGE (A) and MCP-1 (B) in diabetic GK rats. Diabetic control group: five GK rats; atorvastatin-treated diabetic group: four GK rats; and normal control group: five male Wistar rats. Data are expressed as mean ± SD in each group. * compared with the control group, p<0.05.


