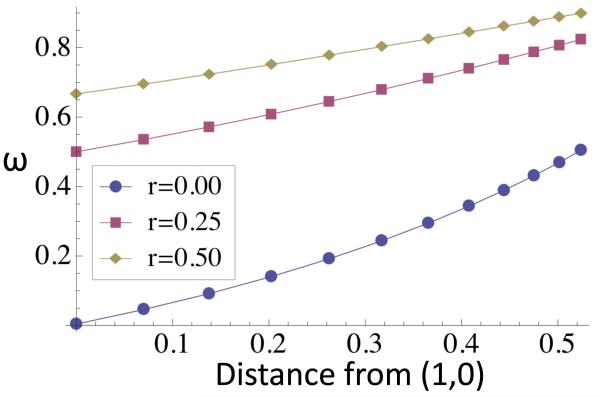
Figure 2.
Relative reproductive rate (5) induced at a neutral marker locus by purifying selection (σ = 0.80, τ = 0.77) at a Type 1 equilibrium under various levels of gene flow. For a given rate of crossing-over between the target of selection and the marker locus (r), the points correspond to an equally-spaced sequence of migration rates from m = 0 to m = 0.11 (beyond which the Type 1 equilibrium fuses with the Type 2 equilibria and becomes unstable). Relative reproductive rate (5) induced at the marker locus (ω) increases with the Euclidean distance of the stable Type 1 equilibrium from the fixation state . For very small backward migration rates (m → 0), the vertical sequence of the leftmost points is very similar to (12), the “gene flow factor” of Bengtsson (1985).

