Figure 12.
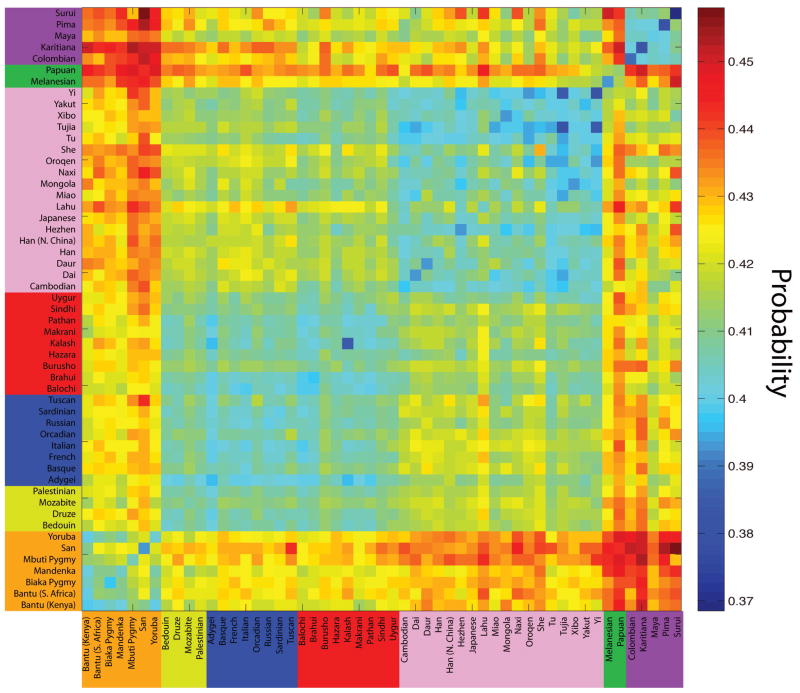
Figure 1. The empirical probability that private alleles lie on the edges of the size distribution in a sample of size four from a pair of populations. Plotted are pairwise calculations of this frequency for all 53 worldwide populations from the Human Genome Diversity Panel, arranged in major geographic regions. African, Middle Eastern, European, Central/South Asian, East Asian, Oceanian, and American populations are arranged by color in the labels. Blue represents a lower probability, and red represents a higher probability. The plot was obtained using the same approach as in Figure 10, except that individual diploid genotypes rather than random pairs of alleles in populations were drawn in our resampling procedure.

