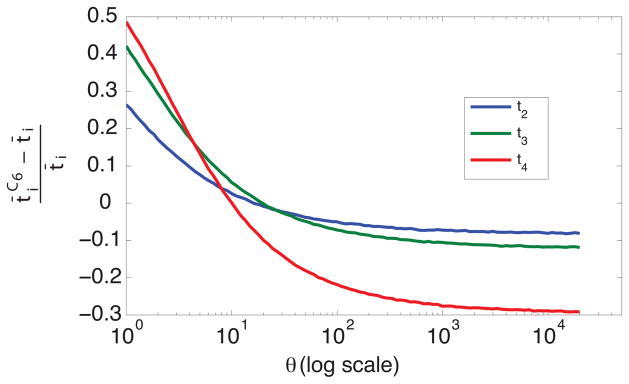
Figure 9.
Relative difference between mean coalescence times conditional on obtaining configuration C6 ( ) and unconditional mean coalescence times (t̄i), as a function of θ (log scale). The mean conditional coalescence times were calculated by taking the mean of 106 simulated coalescence times in scenarios that produced configuration C6.

