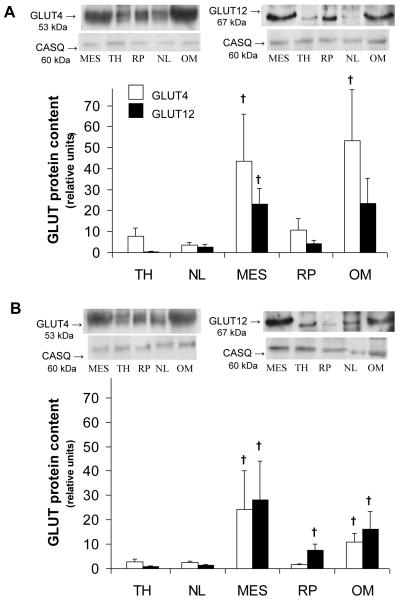
Figure 1.
Insulin-sensitive (A) and insulin resistant (B) states induces differential protein expression of total GLUT -4 (white bars) and -12 (black bars) across various visceral and subcutaneous adipose tissue. Top panel: Representative Western blot of GLUT from a plasma membrane-enriched preparation of adipose tissue. Calsequestrin (CASQ) protein content was used a loading control. Bottom panel: Mean ± SE total content of GLUT protein in omental (OM), retroperitoneal (RP), and mesenteric (MES) (visceral) sites, and nuchal ligament (NL) and tailhead (TH) (subcutaneous) AT depots (n=5/group). Relative units were expressed in relation to the skeletal muscle of insulin-sensitive (IS) and insulin resistant (IR) subjects, respectively. †: significantly greater than all subcutaneous sites within the same group, P<0.05. Please note that there is a tendency for GLUT12 content to be higher in omental site compared to other sites during IS state (P<0.1).

