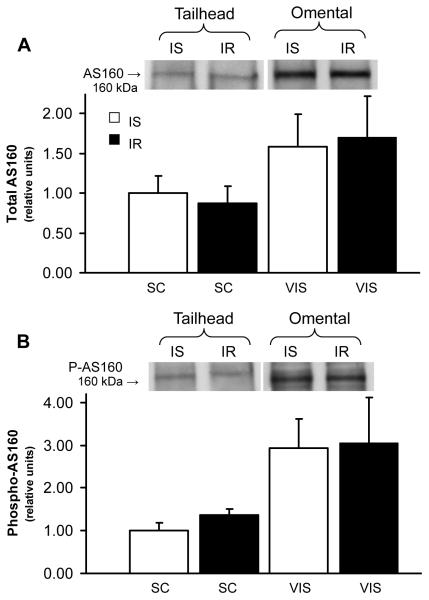
Figure 5.
The decrease in active GLUT4 content in omental tissue occurred despite normal activation of AS160 during insulin resistant state. Total protein content of (A) AS160 and (B) phosphorylated AS160 in adipose tissue during insulin-sensitive (IS) and insulin resistant (IR) state (n=5 per group). Top panel: Representative Western blot of AS160 in adipose total tissue. Bottom panel: Mean ± SE of protein expression of total AS160 (A) and phosphorylated AS160 (B) in subcutaneous (Sc; tailhead) and visceral (Vis; omental and mesenteric) adipose sites.

