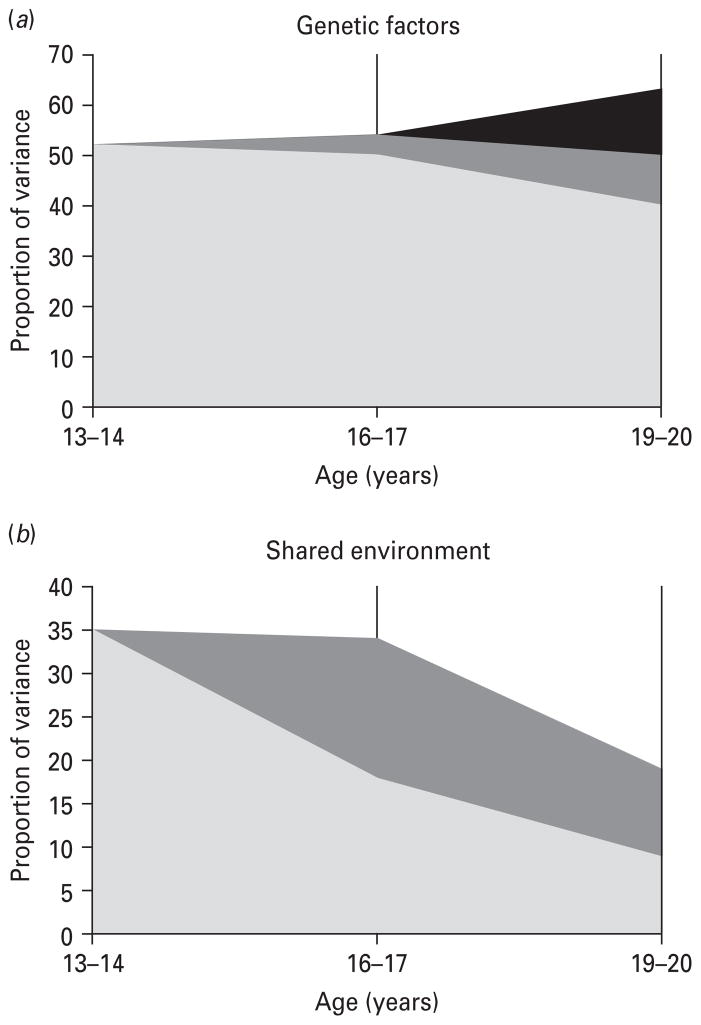
Fig. 2.
Proportion of total variance in substance consumption common factors accounted for by (a) genetic and (b) shared environmental effects at ages 13–14 ( , Factor 1), 16–17 (
 , Factor 2) and 19–20 (■, Factor 3). The y axis represents the total phenotypic variance so the sum of all the factors equals total heritability.

